

Photo by Luke Chesser on Unsplash
Improving Recharts performance
Achieving an 1.8x speedup by reducing DOM measurements.


Hey, there!
I was a bit bored on Sunday afternoon and started looking for a cool task to work on. I have contributed to Recharts in the past, so I decided to take a look at their issue tracker.
I didn't have to search much, since I found a performance problem straight away.

Marvin Hagemeister's series on performance improvements in the JavaScript ecosystem is a big inspiration for me, so followed his method: find low-hanging fruit to squeeze performance out of.
This issue looked like a cool challenge, so the investigation began.
Deep Dive
The issue mentions getStringSize. What does that even do? Let's take a look.
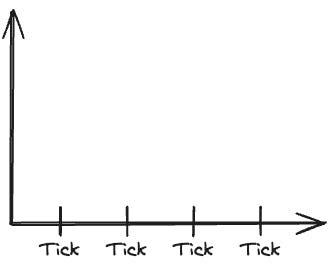
getStringSize accurately measures the width and height of text with a specific style. It is important that it is precise because it will be used to calculate which ticks of an axis should be displayed.
It is implemented as follows:
export const getStringSize = (text: string | number, style: CSSProperties = {}): Size => {
  if (text === undefined || text === null) {
    return { width: 0, height: 0 };
  }

  const cacheKey = JSON.stringify({ text, style });

  if (stringCache.widthCache[cacheKey]) {
    return stringCache.widthCache[cacheKey];
  }

  let measurementSpan = document.getElementById(MEASUREMENT_SPAN_ID);

  measurementSpan.style = { ...SPAN_STYLE, ...style };
  measurementSpan.textContent = `${text}`;

  const rect = measurementSpan.getBoundingClientRect();
  const result = { width: rect.width, height: rect.height };

  stringCache.widthCache[cacheKey] = result;

  if (++stringCache.cacheCount > MAX_CACHE_NUM) {
    stringCache.cacheCount = 0;
    stringCache.widthCache = {};
  }

  return result;
};
The code above is simplified. You can access the original here.
The function first hits a cache to check if there is an entry. If so, it will return those dimensions and skip the rest of the function body.
If there isn't, it will:
Get a specific DOM element;
Apply the styles and insert the text;
Measure the DOM element's dimensions using
getBoundingClientRect().
Basically, it is re-creating the tick's styles and content so that it can measure it accurately.
Finally, it will cache the result for future usage.
Cool, but what's the problem?
From my investigation, rendering a 10 000 item chart will produce the following flame chart:
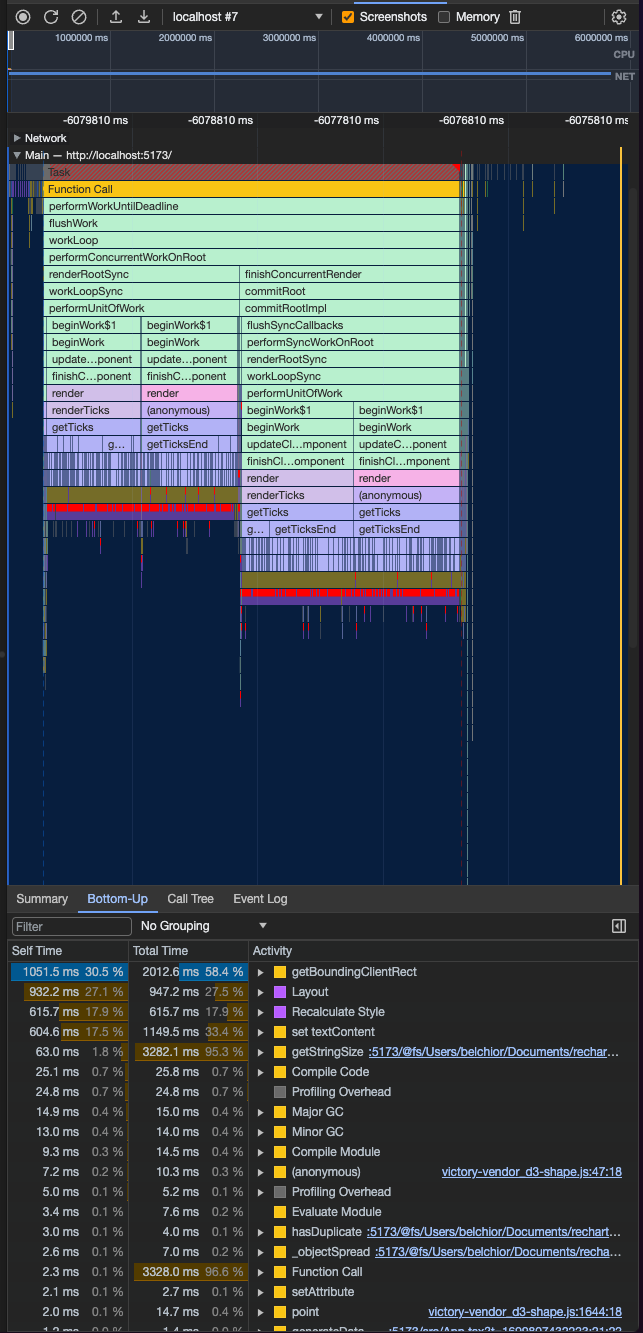
It is sorted so that the operations that take longer are shown on top.
Here, we can see multiple culprits:
getBoundingClientRect, which takes up ~30% of the time to render the chart;Layoutat 27%;Recalculate Styleandset textContent, both of which comprise around 18% of the time spent rendering, ~36% in total.
These 4 procedures are taking up ~95% of the whole rendering time!
From the "Total Time" column, we can see that getStringSize is taking up most of the time when rendering, but why?
By introducing a counter at the start of the function, I could notice that it was being called 40 000 times for a 10 000 item chart. The function is expensive, but is clear that we're also calling it more times than needed.
Now, if we could reduce the number of times we call this function, we might be able to improve performance dramatically.
The Problem
If you took a closer look at the flame chart above, you could see that the function taking the longest total time is getStringSize. Its caller is getTicksEnd, so let's take a look at it.
function getTicksEnd(
  // Boundaries of the axis. No tick can render outside.
  boundaries: { start: number; end: number },
  // Returns the size of the axis.
  getTickSize: (tick: CartesianTickItem, index: number) => number,
  // Candidate ticks to be shown if they pass the visibility test.
  ticks: CartesianTickItem[],
  // Minimum gap between visible ticks.
  minTickGap: number,
): CartesianTickItem[] {
  const result = (ticks || []).slice();
  const len = result.length;

  const { start } = boundaries;
  let { end } = boundaries;

  for (let i = len - 1; i >= 0; i--) {
    let entry = result[i];
    const size = getTickSize(entry, i);
    if (i === len - 1) {
      const gap = entry.coordinate + ( size / 2 ) - end;
      result[i] = entry = {
        ...entry,
        tickCoord: gap > 0 ? entry.coordinate - gap : entry.coordinate,
      };
    } else {
      result[i] = entry = { ...entry, tickCoord: entry.coordinate };
    }

    const isShow = isVisible(entry.tickCoord, size, start, end);

    if (isShow) {
      end = entry.tickCoord - (size / 2 + minTickGap);
      result[i] = { ...entry, isShow: true };
    }
  }

  return result;
}
The code above is simplified. You can access the original here.
The algorithm might be a bit complex, but the gist of the function is: iterate backwards from the last tick to find all visible ticks. This means that the last tick will always be visible -- unless it's larger than the axis' size.

To verify if a tick fits, Recharts checks if it could be displayed without intersecting any boundary by calling isVisible:
function isVisible(
  tickPosition: number,
  size: number,
  start: number,
  end: number,
): boolean {
  return tickPosition - (size / 2) >= start &&
    tickPosition + (size / 2) <= end;
}
The code above is simplified. You can access the original here.
This function is straightforward, but it highlights why the tick's size is required: since the text will be centered around the tick's position, we need to ensure that the tick plus/minus half its size won't intersect the start or end boundary, respectively.

After a tick is regarded as visible, the end boundary will be reduced by half the tick's size plus the minimum gap between ticks. The next ticks will be checked to see if they fit within these new boundaries.
As you probably noticed before, a tick's size is measured by calling getTickSize, which, in turn, calls getStringSize. This is what is causing the performance problem: we are checking the size of 10 000 ticks!
The bandage
The benefit of having so many ticks is that most of them won't fit in such a small space. For example, if the boundaries are { start: 100, end: 600 }, we have 500px to place thousands of ticks.
Let's say we have 5000 ticks: that means we must place ticks 0.1px apart!
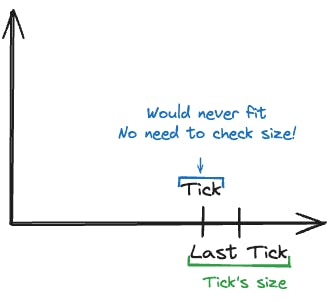
Knowing this, we can do a small optimization: do not check size if the tick's start would be outside the boundaries.
If we don't need to check the tick's size, we don't have to measure it, so we skip all the expensive operations!
This is the base premise for my contribution to Recharts.
The isVisible function now checks the tick's position first. If it doesn't fit inside the boundaries, it can skip measuring the tick's size. If the tick's position fits inside the boundaries, then we'll need to calculate the size anyway.
export function isVisible(
  tickPosition: number,
  getSize: () => number,
  start: number,
  end: number,
): boolean {
  /* Since getSize() is expensive (it reads the ticks'
   * size from the DOM), we do this check first to
   * avoid calculating the tick's size. */
  if (tickPosition < start || tickPosition > end) {
    return false;
  }

  // The size is only being calculated when actually needed!
  const size = getSize();

  return tickPosition - (size / 2) >= start &&
    tickPosition + (size / 2) <= end;
}
The code above is simplified. You can access the original here.
Changing this function also required updating its calling function. For each tick, we now delay measuring the size as much as possible:
function getTicksEnd(
  // Boundaries of the axis. No tick can render outside.
  boundaries: { start: number; end: number },
  // Returns the size of the axis.
  getTickSize: (tick: CartesianTickItem, index: number) => number,
  // Candidate ticks to be shown if they pass the visibility test.
  ticks: CartesianTickItem[],
  // Minimum gap between visible ticks.
  minTickGap: number,
): CartesianTickItem[] {
  const result = (ticks || []).slice();
  const len = result.length;

  const { start } = boundaries;
  let { end } = boundaries;

  for (let i = len - 1; i >= 0; i--) {
    let entry = result[i];
    // We're now caching the size and only compute it if needed!
    let size: number | undefined;
    const getSize = () => {
      if (size === undefined) {
        size = getTickSize(entry, i);
      }

      return size;
    };

    if (i === len - 1) {
      const gap = entry.coordinate + (getSize() / 2) - end;
      result[i] = entry = {
        ...entry,
        tickCoord: gap > 0 ? entry.coordinate - gap : entry.coordinate,
      };
    } else {
      result[i] = entry = { ...entry, tickCoord: entry.coordinate };
    }

    const isShow = isVisible(entry.tickCoord, getSize, start, end);

    if (isShow) {
      end = entry.tickCoord - (getSize() / 2 + minTickGap);
      result[i] = { ...entry, isShow: true };
    }
  }

  return result;
}
The code above is simplified. You can access the original here.
And that's all there is to it!
Results
So, what's the end result?
For a 10 000 item chart, the direct results are:
There's 2.2x less
getStringSizecalls: around 18k, down from 40k;There's a 1.8x speedup when rendering the chart: 1.8s instead of 3.2s;
Note: these weren't properly benchmarked i.e., averaged over several runs, so take the results with a grain of salt.
There was also one indirect result: Recharts' cache size contains 2000 entries. By skipping measurements, it's less likely that useful entries are evicted from the cache, resulting in more cache hits.
Fortunately, there's still some low-hanging fruit regarding performance in Recharts. For example, Recharts' cache evicts the whole cache when it is over the 2000 entry limit. If you're interested, this topic is being discussed in this issue.
Also, you may have noticed that we're still calling getStringSize 18 000 times, which seems excessive since there's only 10 000 data points.
If you want to take advantage of this improvement, make sure you upgrade to Recharts v2.10.
Thank you for reading! If you liked this post, I'd highly recommend Marvin Hagemeister's "Speeding up the JavaScript ecosystem" series.
Follow me on Twitter if you'd like to keep up with new articles.