Creating a Scratch Map using JavaScript & OpenLayers 5
Hello, dear reader!
I have been working full time with OpenLayers for the last three months and, given the lack of up-to-date tutorials on how to use this incredible library, I felt that it was my moment to give back to the community.
This tutorial will walk you through the creation of a scratch map using OpenLayers v5.1.3 and only 64 lines of JavaScript!
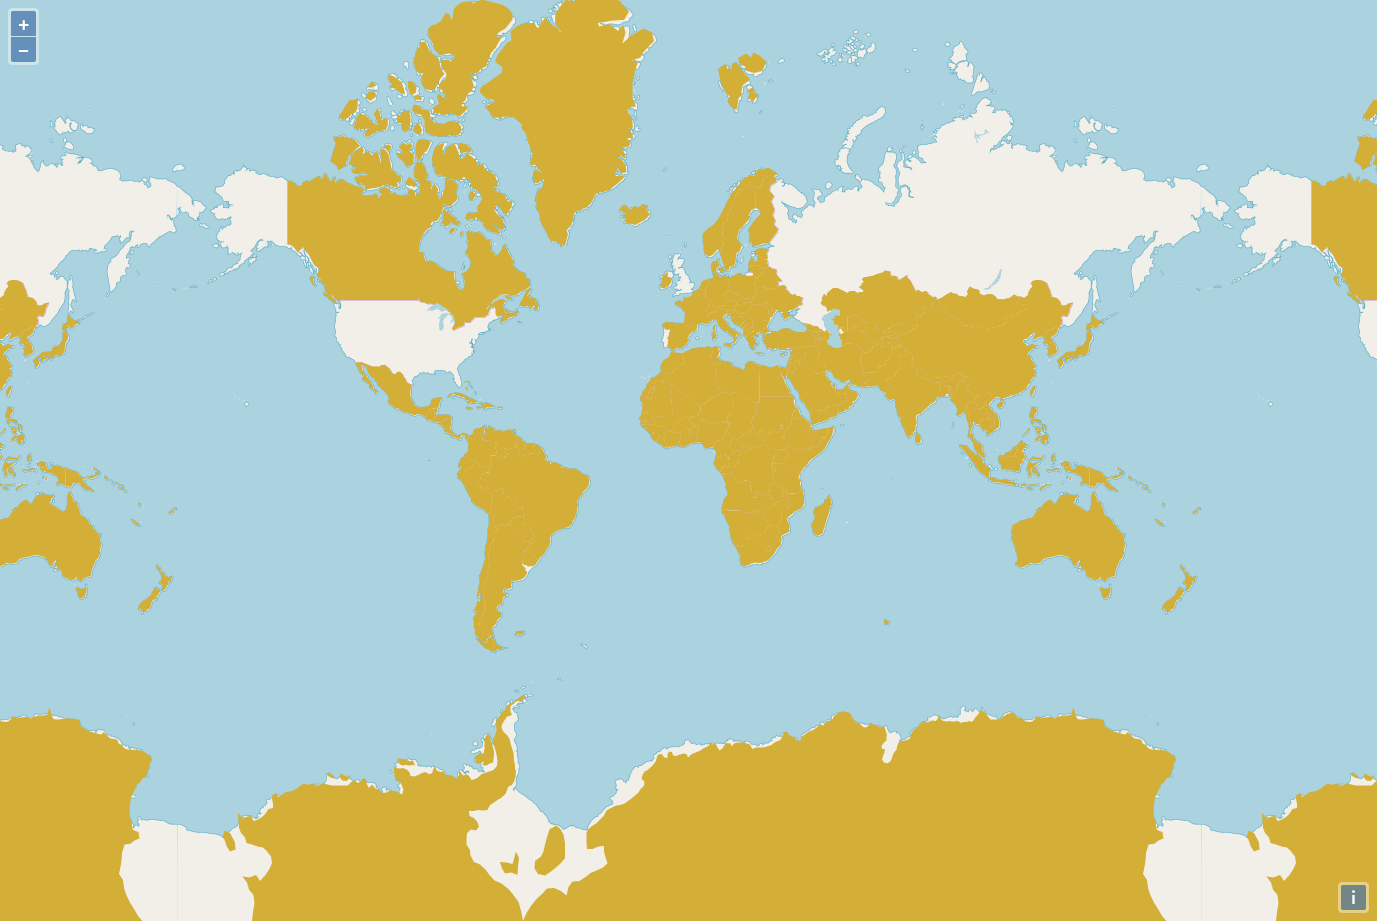
You can see the final result of this tutorial here and access the repository here.
Note: To follow this guide, you should have a JavaScript package manager like npm or yarn installed. I’ll be using npm during this tutorial.
Starting Point
First, we’ll use a bundler so that we can enjoy recent JavaScript features. I’ll be using Webpack, but you can use your favorite one. I have prepared a start baseline project so you don’t have to worry about that. It was based on webpack-start-basic so I wouldn’t have to mess with webpack configuration.
OpenLayers Scratch Map Tutorial Repository
Our starting point will be the start branch, so make sure you git checkout start. For the sake of efficiency, install the dependencies by running npm install while you read the next section.
Project Structure
The most important files are index.html and src/index.js. The first contains the entry point of the application and webpack will inject the JavaScript file as a script tag for us.
<!DOCTYPE html>
<html lang="en" style="height: 100%;">
<head>
    <meta charset="UTF-8">
    <meta name="viewport" content="width=device-width, initial-scale=1">
    <title>OpenLayers Scratch Map Tutorial</title>
    <link rel="stylesheet" href="https://cdn.rawgit.com/openlayers/openlayers.github.io/master/en/v5.1.3/css/ol.css"
          type="text/css">
</head>
<body style="margin: 0; height: 100%">
    <div id="map" style="height: 100%"></div>
</body>
</html>
The index.html file is pretty basic, but there are some things we should focus on:
- The
height: 100%;style applied to thehead,bodyanddivtags that will allow our map to take the whole screen. - The inclusion of the OpenLayers stylesheet using the
linktag. - The
id="map"in thedivtag. This will act as the element on which the map will be drawn.
Understanding OpenLayers
OpenLayers provides an extensive API for map and data management and charting. Since this is a beginner tutorial, we’ll only scratch the surface of all its capabilities and more information and examples can be found in the OpenLayers website.
The most important part of our Scratch Map is — unexpectedly — the Map . The OpenLayers Map is the core component of the library and its attributes of most use to us are target, view and layers:
- The
targetis the DOM element in which the map will be drawn. This is the reason why we created adivwithid="map"inindex.html. - The
viewinstructs how we will see our map. layersdefines the order and content of what should be drawn on the map.
A layer is crucial to displaying something interesting to the user. There are several types of layers, e.g. VectorLayer, ImageLayer, TileLayer.
In this tutorial, we’ll focus on tile and vector layers. The first allows us to display a map of the world, while the second gives us the ability to draw single and independent entities — called features — on top of it.
Every layer also has a source, which is where the data being displayed comes from. We’ll be using OpenStreetMap for the world map and a GeoJSON with countries coordinates, obtained from an OpenLayers example.
Running the Project
Now that you have a basic understanding of how OpenLayers works, we are ready to start coding!
In order to run the project, simply execute the following command inside the project’s root directory — where your package.json file is located.
npm start
If you cloned the repository and are starting from the start branch, you should head to localhost:8080 and see a blank screen.
Creating a Map
First of all, we need to create a Map. In order to do that, we’ll need a target— the div we created — , a view — centered on (0, 0) with a default zoom level — and, finally, some layers.
import View from 'ol/View';
import Map from 'ol/Map';

// Wait for the page to load, otherwise getElementById may not work.
window.onload = () => {
    const target = document.getElementById('map')

    // Create a new map with the target as the div#map, and without layers - for now.
    new Map({
        target,
        view: new View({
            center: [0, 0],
            zoom: 2,
        }),
        layers: [ /* To be added later */]
    });
}
By now, you should see a white map with some controls appear, like zoom in and zoom out buttons.

Creating the World Map Layer
In order to create the world map layer, we first need to select the type of layer to instantiate. We’ll use a TileLayer because the world map will be rendered in tiles (otherwise we’d have to download the map of the whole world before using it!).
Next, we have to choose a source. As said before, we’ll be using OpenStreetMap, as OpenLayers already provides a source that implements it and it’s very simple to use.
To achieve this, we only have to add two new imports TileLayer and OSM and instantiate the classes like shown below.
import View from 'ol/View';
import Map from 'ol/Map';
/* New imports */
import TileLayer from 'ol/layer/Tile';
import OSM from 'ol/source/OSM';

window.onload = () => {
    const target = document.getElementById('map')

    new Map({
        target,
        view: new View({
            center: [0, 0],
            zoom: 2,
        }),
        layers: [
            // New TileLayer with OpenStreetMap as a source
            new TileLayer({
                source: new OSM(),
            })
        ]
    });
}
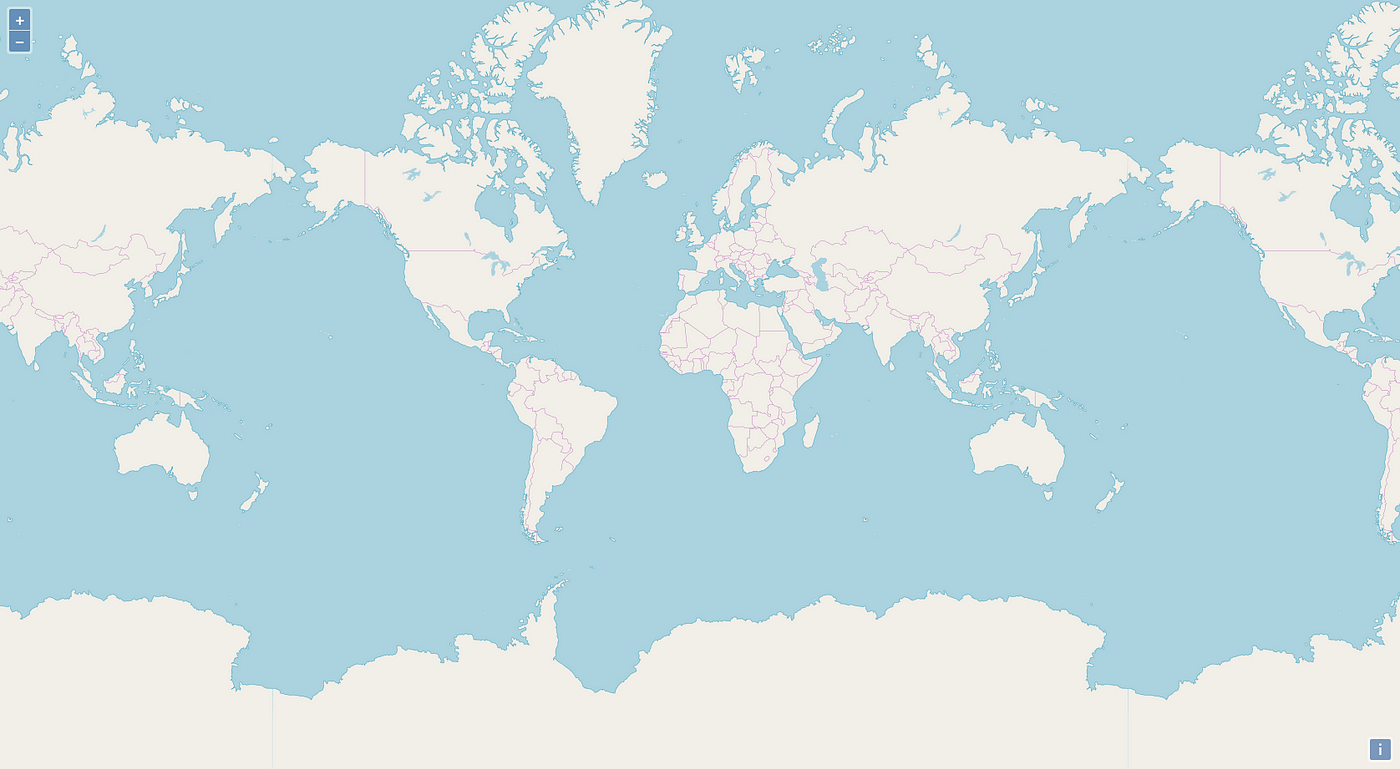
By now, your map should look like this:
Adding the Scratching layer
Great, we have a world map! Now we’ll need to focus on adding the “scratching” layer. To achieve that, we’ll use the [countries.geojson](https://raw.githubusercontent.com/bernardobelchior/openlayers-scratch-map-tutorial/start/countries.geojson) from the OpenLayers example. It is available there as a link or in the root of the repository.
In order to obtain the layer, we’ll use a VectorLayer with a VectorSource and the url being one that points to the countries.geojson file.
Vector layers are used to draw vector features on a map. These are one of the most useful abstractions in OpenLayers as they give you access to interactions like drawing, modifying and selecting.
import View from 'ol/View';
import Map from 'ol/Map';
import TileLayer from 'ol/layer/Tile';
import OSM from 'ol/source/OSM';
/* New imports */
import VectorLayer from 'ol/layer/Vector';
import VectorSource from 'ol/source/Vector';
import GeoJSON from 'ol/format/GeoJSON';

window.onload = () => {
    const target = document.getElementById('map')

    new Map({
        target,
        view: new View({
            center: [0, 0],
            zoom: 2,
        }),
        layers: [
            new TileLayer({
                source: new OSM(),
            }),
            // New VectorLayer with VectorSource and the countries.geojson file as source
            new VectorLayer({
                source: new VectorSource({
                    url: 'https://raw.githubusercontent.com/bernardobelchior/openlayers-scratch-map-tutorial/start/countries.geojson',
                    format: new GeoJSON(),
                })
            })
        ]
    });
}
Now, you should see something like this:
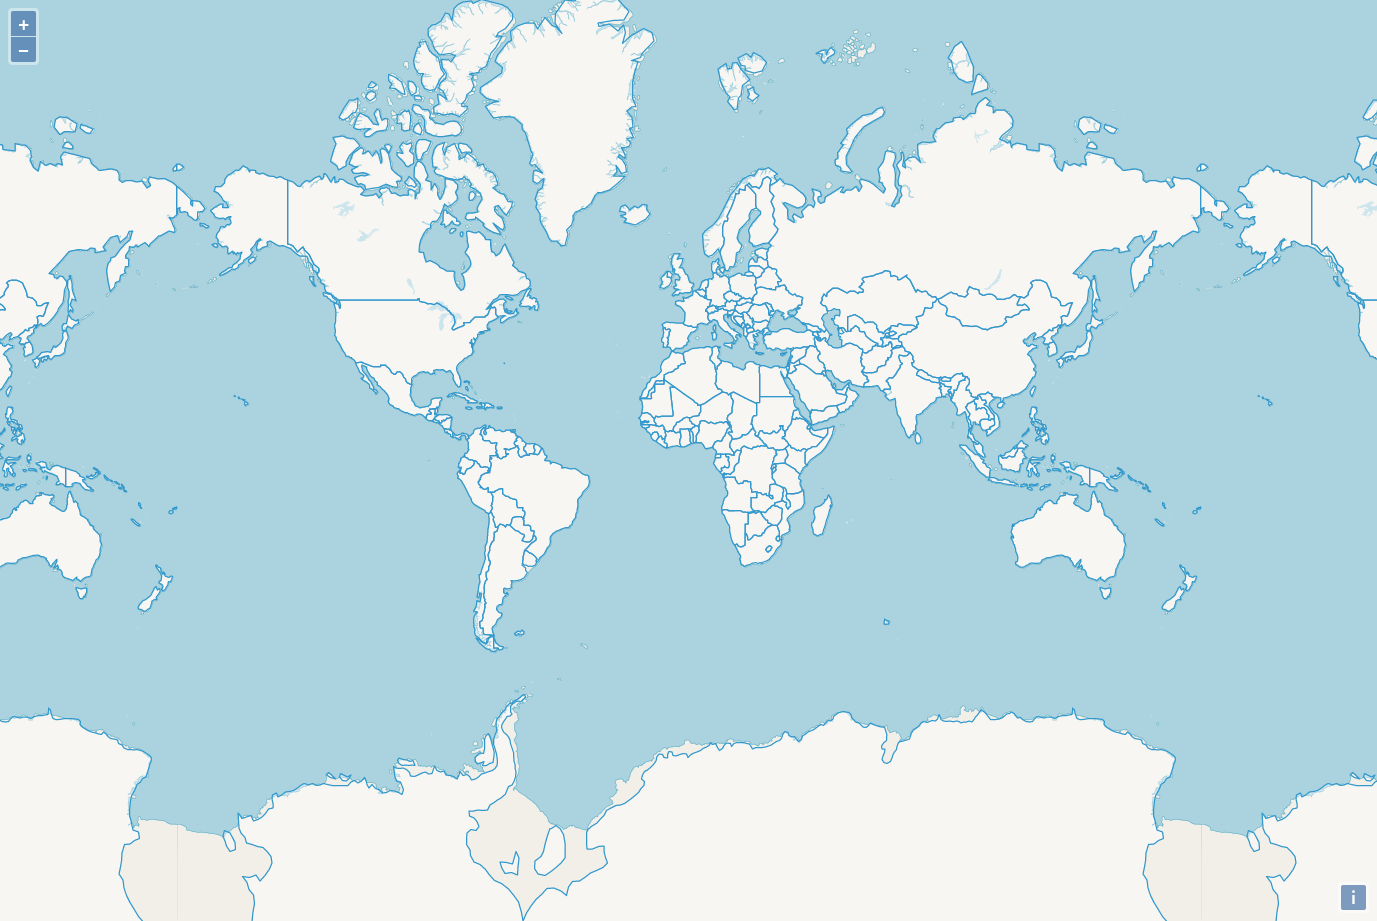
You now see that there is a layer on top of the world map. Unfortunately, the countries.geojson coordinates do not match the OpenStreetMap coordinates perfectly, so we have some mismatches. But for the purpose of this tutorial, that’s acceptable.
Styling the Scratch Map
If you’ve ever seen a scratch map, almost all of them have a gold layer on top that you scratch. And that’s what we’re here to do! OpenLayers provides styling options through its [Style](http://openlayers.org/en/latest/apidoc/module-ol_style_Style-Style.html) class. You can, then, add that style to a VectorLayer in order to style all the countries!
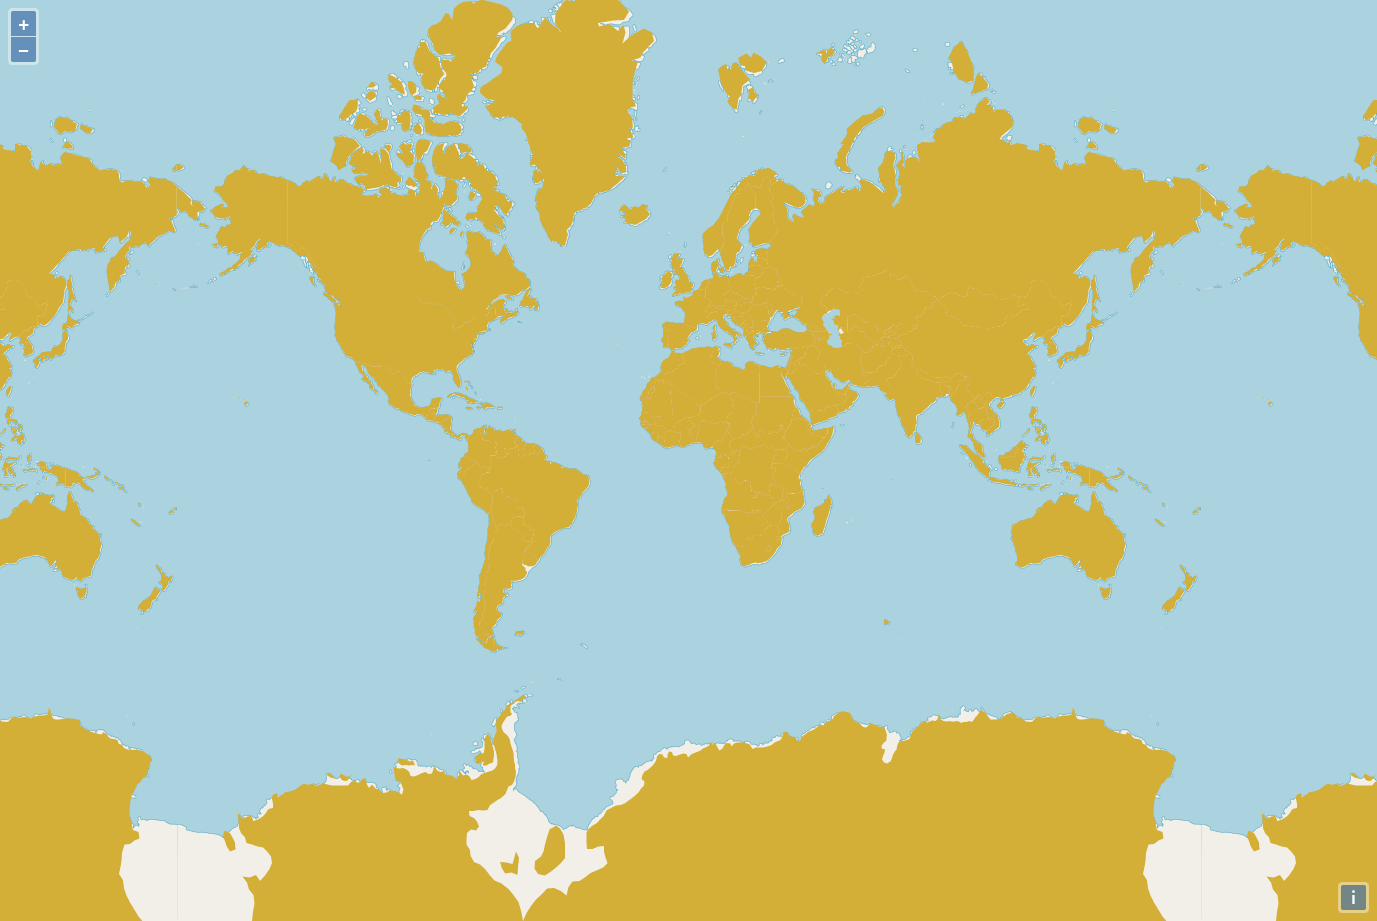
In this example, we’ll use #D4AF37 as our gold color. The only thing we need to do is to instantiate a new Style with an object containing the fill property which is, in turn, an instance of Fill with our gold color specified.
This will style all the features in the VectorLayer by filling them with the given color.
import View from 'ol/View';
import Map from 'ol/Map';
import TileLayer from 'ol/layer/Tile';
import OSM from 'ol/source/OSM';
import VectorLayer from 'ol/layer/Vector';
import VectorSource from 'ol/source/Vector';
import GeoJSON from 'ol/format/GeoJSON';
/* New imports */
import Style from 'ol/style/Style';
import Fill from 'ol/style/Fill';


window.onload = () => {
    const target = document.getElementById('map')

    new Map({
        target,
        view: new View({
            center: [0, 0],
            zoom: 2,
        }),
        layers: [
            new TileLayer({
                source: new OSM(),
            }),
            new VectorLayer({
                source: new VectorSource({
                    url: 'https://raw.githubusercontent.com/bernardobelchior/openlayers-scratch-map-tutorial/start/countries.geojson',
                    format: new GeoJSON(),
                }),
                // New Style that fills the countries with the color #D4AF37
                style: new Style({
                    fill: new Fill({
                        color: '#D4AF37',
                    })
                })
            })
        ]
    });
}
After this step, we should witness something like this:
Painting only visited places
This part is clearly the mostly complicated. In order to simplify it a bit, we’ll first paint all countries and then remove the ones we’ve visited. At the end of this part, I’ll show the whole index.js .
First of all, we must select the places we want to remove, I’ve chosen the following but you are free to choose any others.
/* [longitude, latitude] */
const visitedPlaces = [
    [-0.118092, 51.509865], // London, United Kingdom
    [-8.61099, 41.14961], // Porto, Portugal
    [-73.935242, 40.730610], // New York, USA
    [37.618423, 55.751244], // Moscow, Russia
]
Afterwards, we’ll need to extract the VectorSource we defined above into its own variable, as we’ll need to check if it’s done loading before deleting the visited places.
window.onload = () => {
    const target = document.getElementById('map')

    // countriesSource is a variable holding the vector source with countries from countries.geojson
    const countriesSource = new VectorSource({
        url: 'https://raw.githubusercontent.com/bernardobelchior/openlayers-scratch-map-tutorial/start/countries.geojson',
        format: new GeoJSON(),
    })

    new Map({
        target,
        view: new View({
            center: [0, 0],
            zoom: 2,
        }),
        layers: [
            new TileLayer({
                source: new OSM(),
            }),
            new VectorLayer({
                // Old instantiation moved to countriesSource
                source: countriesSource,
                style: new Style({
                    fill: new Fill({
                        color: '#D4AF37',
                    })
                })
            })
        ]
    })
// ....
}
Now that we have everything ready for the actual deletion of countries, let’s get started!
As said above, we’ll have to until the countriesSource has finished loading, which is done by waiting on the addfeature event to fire. Afterwards, we’ll iterate through each visited place and convert its longitude and latitude into map coordinates, using the fromLonLat function.
Having the visited place represented in map coordinates, we can use the getFeaturesAtCoordinate function to return an array of all the features — in this case countries — that contain that coordinate. Finally, for each Feature found, we’ll remove it from the countriesSource, which will make them disappear from the map!
/* New import at the top*/
import { fromLonLat } from 'ol/proj'

// Wait for source to render
countriesSource.once('addfeature', () => {
    // For each visited place
    visitedPlaces.forEach(place => {
        // Obtain map coordinates from longitude and latitude
        const coordinate = fromLonLat(place)

        // For each feature at coordinate, remove it from the source
        // Because OpenLayers observes for changes, this will visually delete the countries from the map.
        countriesSource.getFeaturesAtCoordinate(coordinate).forEach(f => countriesSource.removeFeature(f))
    })
})
Your whole index.js should now look like this:
import View from 'ol/View'
import Map from 'ol/Map'
import TileLayer from 'ol/layer/Tile'
import OSM from 'ol/source/OSM'
import VectorLayer from 'ol/layer/Vector'
import VectorSource from 'ol/source/Vector'
import GeoJSON from 'ol/format/GeoJSON'
import Style from 'ol/style/Style'
import Fill from 'ol/style/Fill'
/* New import */
import { fromLonLat } from 'ol/proj'

/* [longitude, latitude] */
const visitedPlaces = [
    [-0.118092, 51.509865], // London, United Kingdom
    [-8.61099, 41.14961], // Porto, Portugal
    [-73.935242, 40.730610], // New York, USA
    [37.618423, 55.751244], // Moscow, Russia
]

window.onload = () => {
    const target = document.getElementById('map')

    // countriesSource is a variable holding the vector source with countries from countries.geojson
    const countriesSource = new VectorSource({
        url: 'https://raw.githubusercontent.com/bernardobelchior/openlayers-scratch-map-tutorial/start/countries.geojson',
        format: new GeoJSON(),
    })

    new Map({
        target,
        view: new View({
            center: [0, 0],
            zoom: 2,
        }),
        layers: [
            new TileLayer({
                source: new OSM(),
            }),
            new VectorLayer({
                // Old instantiation moved to countriesSource
                source: countriesSource,
                style: new Style({
                    fill: new Fill({
                        color: '#D4AF37',
                    })
                })
            })
        ]
    })

    // Wait for source to render
    countriesSource.once('addfeature', () => {
        // For each visited place
        visitedPlaces.forEach(place => {
            // Obtain map coordinates from longitude and latitude
            const coordinate = fromLonLat(place)

            // For each feature at coordinate, remove it from the source
            // Because OpenLayers observes for changes, this will visually delete the countries from the map.
            countriesSource.getFeaturesAtCoordinate(coordinate).forEach(f => countriesSource.removeFeature(f))
        })
    })
}
If everything went well, you should now be able to see something like this:

The end
Congratulations! You’ve made it until the end! Hopefully, you’ve learned something new and valuable to you and have understood how powerful OpenLayers is.
If you liked the tutorial, share it with your friends. You can see the final result here and access the repository here.
If you’d like to know more about me, you can visit my website belchior.me.
Thank you for reading!